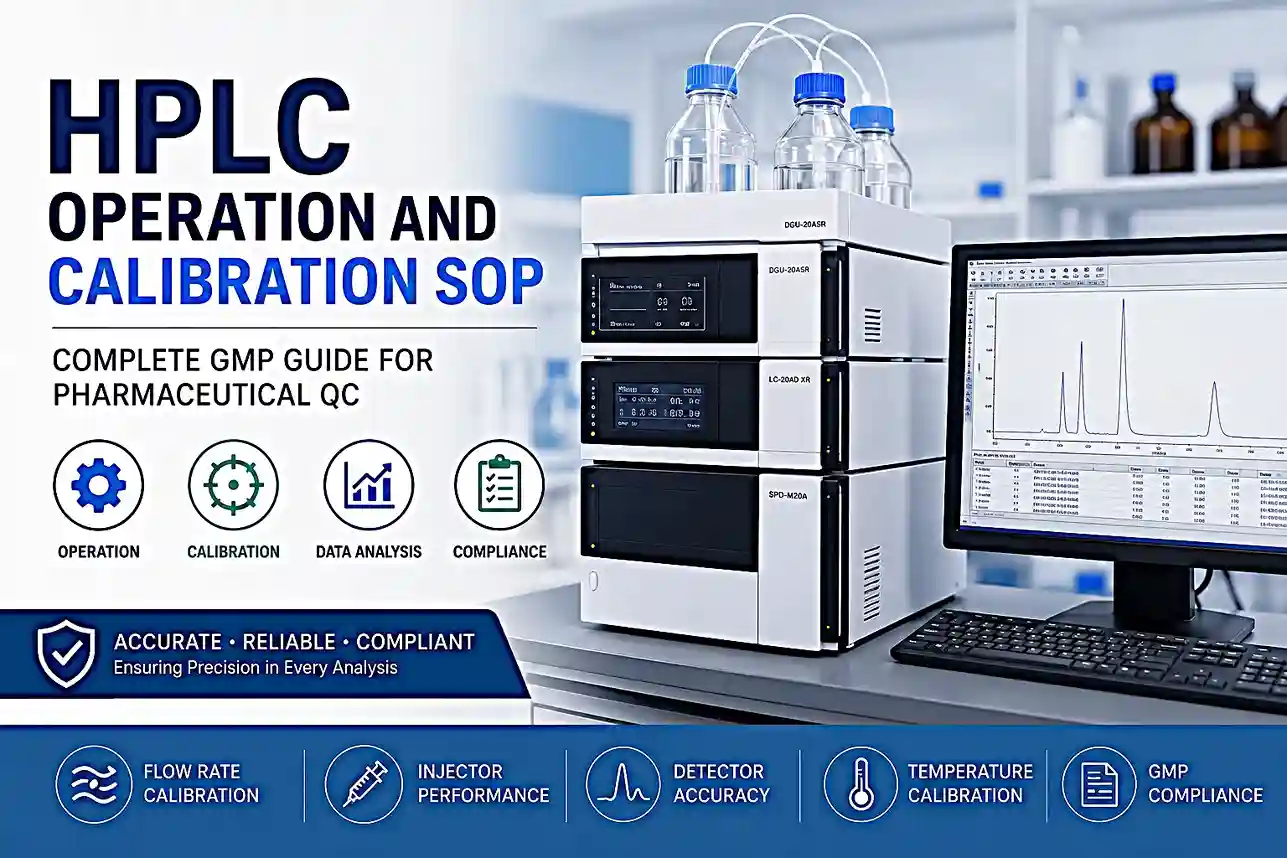
Purpose of HPLC Operation and Calibration
To define the procedure for calibration and Operation of HPLC in QC lab. To operate the HPLC as per approved procedure and to calibrate it with standard procedure.
Scope of the SOP
This SOP is applicable for operating & calibration procedure for HPLC in the QC facility in your company.
Read Full Article
Laminar Air Flow Full Qualification Guide
Roles & Responsibility:
| Designation | Responsibilities |
| Quality Control Officer/Executive | To carry out operation of HPLC as per the SOP. To carry out calibration of HPLC System as per the SOP. |
| Quality Control Head | Complete implementation and compliance as per SOP. |
Reference for HPLC Operation and Calibration
ICH Q2(R2)
Abbreviations used:
| RSD | Relative Standard Deviation |
| NMT | Not More Than |
| oC | Degree Celcius |
| SD | Standard Deviation |
| Nm | Nanometer |
| ppm | Parts per million |
| µl | Micro litre |
| ml | Mililitre |
| mg | Milligram |
| CU | Content uniformity |
Training Requirement
Personnel must:
- Read and understand the SOP.
- Complete training before performing related activities.
- Undergo periodic retraining as and when required.
Step-by-Step HPLC Operation and Calibration
Prerequisites Before Operating HPLC
Check the general cleaning of the instrument.
Switch on the instrument allow displaying the MENU screen.
Keep the mobile phase bottles after filtration.
Operation:
Check the general cleaning of the instrument.
Switch on the instrument allow displaying the MENU screen.
Keep the mobile phase bottles after filtration.
Purge the mobile phase line by pressing the PURG button provided below to the display on the Instrument.
Switch on the computer with user ID and password.
Go to desk top and Double-click the related Software icon on the Desktop.
Select a registered user ID from the [User ID] list, enter the [Password] and click [OK].
After clicking OK, open [Select Project] window in login first time login.
Guide HPLC about [Select Project].
The window displays an icon bar and a box for selecting a specific operation of a selected icon as described below.
| S. No. | Explanation |
| 1 | Displays the [Standard] toolbar, [Data Acquisition] toolbar, [Instrument Control] toolbar, [LC Control] toolbar. |
| 2 | Displays chromatograms and the instrument status curves. |
| 3 | Displays the instrument status and parameter settings. |
| 4 | Click to transfer the data acquisition settings set in [Instrument Parameters View] to the analytical instrument. |
| 5 | Displays the instrument parameters for data acquisition. In the [Normal] sub-window, the main data acquisition parameters are set on the [Simple Settings] and [LC Time Prog.] tabs. In the [Advanced] sub-window, the tab for each configured instrument module is displayed so that data acquisition parameters can be set in more detail. |
| 6 | Switches between the full screen and normal display. |
Method Creation in HPLC Software -HPLC Operation and Calibration
In the [Normal] sub-window, the main data acquisition parameters are set on the [Auto samplers] and [GC] tabs. In the [Advanced] sub-window, a tab for each configured instrument module is displayed so that data acquisition parameters.
- Click [Advanced] to open the [Advanced] sub-window.
- Click the [Simple Settings] tab and enter the data acquisition parameters.
- Click the [LC Time Prog.] tab, and enter the concentration gradient conditions if gradient profile applicable.
- Click [Save Method File As] on the [File] menu.
The [Save Method File As] window is displayed.
- Enter the file name, and click [Save].
A method file is created with the specified file name and the new instrument parameters are saved to the file.
Batch Sequence Creation
Create a Batch Table Using Quick Batch icon.
- Go to “Related Icon” and opens with “Real Time Analysis” mode → Go to tools on status bar and select quick Batch.
- Feed the details about the samples like sample ID, Sample type, Method file, Analysis type, level etc.
- Go to batch file and select the saved batch file and print.
- Data Files: Generic Name ddmmyyyy_001 (eg. 18052017_001, where 17 date, 05 month and 2017 year and 001 is sequence no.)
- Sample Name:
- Sample ID: CU or Assay-Test sol-01….. to as required.
- Sample set name: Generic Name ddmmyy
- Before start of the actual sample sequence, if required, system suitability check can also be done to check the system suitability criteria (Tailing factor, Plate counts etc.)
- To start the batch sequence, go to Real time Analysis:Press start real time batch and open saved batch sequence select and run.
Added items to display in the Batch Table:
Go to view→ Table style → click to summary type and summary report format file to the items to display in the Batch Table.
Sample Preparation and Injection – HPLC Operation and Calibration
- Prepare standard solution and sample solutions.
- Go to Instrument and select “Start up” the sequence prepared starts.
- If partial sequence needs to start select the row to be injected.
- After completing the sequence go to post run.
- Processing of the injections/samples (Data Analysis).
Click the icon in the [Mains] window
- Go to post run and select project for which data to be printed.
- Instrument will set up desired method Drag-and-drop a data file onto the [Data Analysis] window from the [Data Explorer] sub window.
Data Processing and Chromatogram Analysis
This section describes how to view and use the [Data Analysis] window.
- To set peak integration parameters follow below mention steps:
- Click (Edit Mode) in [Method View]. Click the [Integration] tab, and change the parameters as required. Click to change the integration time program and peak selection range. If analysis was performed on multiple detectors, the parameter changes can be applied to the other channels by clicking [Copy to All Channels]. Click [Noise/Drift Calculation], and make changes to the [Noise/Drift Calculation Settings] in the sub window that is displayed.
- Click (View Mode) in [Method View]. The data loaded in the [Data Analysis] window is reanalyzed according to the new parameter settings. Check the processing results in the [Chromatogram View] and [Results View].
- Remove Integration of Unwanted Peaks with Minimum Area/Height:
- Click (Edit Mode) in [Method View].
- Click the [Integration] tab, and change the [Min. Area/Height] value to “10000″.
- Click (View Mode) in [Method View].
- The data loaded in the [Data Analysis] window is reanalyzed according to the new parameter settings. Check the processing results in the [Chromatogram View] and [Results View].
- Remove Integration of Unwanted Peaks with the Integration Time Program. Unwanted peaks can also be deleted by setting period in which peak detection is not performed in the Time Program Table in the [Integration Time Program] sub-window.
- Click (Edit Mode) in [Method View].
- Click the [Integration] tab, and click.
- Create an integration time program, and click [OK].
- Click (Period of “Integration Off”).
- Use the cursor to select the start and end positions of the range where integration is not performed.
- Evaluate the [Start Time] and [End Time] in the [Period of “Integration Off”] sub-window, and click [Simulate] the time and processing commands are added to the time program. Examine the resulting integration.
- Click (View Mode) in [Method View]. The data loaded in the [Data Analysis] window is reanalyzed according to the new parameter settings. Check the processing results in the [Chromatogram View] and [Results View].
- Analyze Tailing Peaks, if tailing peak observed with the main analyte peak, then following steps to be performed to integrate the peaks.
- Click (Edit Mode) in [Method View].
- Click the [Integration] tab, and click
- Set the peak to perform tailing processing on, and click [OK].
- Click (Period of “Tailing On”).
- Evaluate the [Start Time] and [End Time] in the [Period of “Tailing On”] sub-window, and click [Simulate]. The time and processing commands are added to the time program.
HPLC Operation and Calibration Procedure
- For Related substances data standard and system suitability injection auto integration to be done.
- For Sample chromatograms auto integration required, if found any auto integration is not giving appropriate peak marking then manual integration shall be done with same parameters to all peaks with justification. Following steps to be performed for Manual Peak Integration.
- Select injection for review and right click Manual Integration Bar (Normal Toolbar): It is possible to manually integrate peaks that are not properly integrated using the automatic integration parameters in the method file.
- Two [Manual Integration Bar] toolbars are available. Right-click the [Manual Integration Bar] to select either [Normal Toolbar] or [Advanced Toolbar].
- Right-click on a [Zoomed Chromatogram] in the [Data Analysis] window, and click [Manual Integration Bar].
- Click (Move BL), and edit the processing of the chromatogram.
- Click (Unify Peaks), and select the beginning and end points for the area of the chromatogram where all of the peaks will be combined as one.
- Following the message displayed on the status bar, place the cursor, displayed on the chromatogram at the peak unify start point and click.
- Following the message displayed on the status bar, place the cursor at the peak unify end point and click.
- The peaks in the selected range are integrated and displayed as a single peak.
Chromatogram Analysis
- Go to post run and select project for which data to be printed.
- Double click on the post run, window will open click on Database and ok.
- Window will open in post run analysis showing tools bar (Data/Method/Report Format.
- Go to report Format and select open Report template like System suit/General/RSD templates as Required.
- Go to the Data and select the required injection/injections which have to be printed and drag to the report format.
- Go to file and print the chromatograms.
- After print the chromatograms calculation should be done immediately in Validated Excel sheet or in the controlled worksheets
- Record the operation detail.
Flow Rate Calibration
- Take a 25-mL clean and dry Class “A” volumetric flask.
- Prime solvent port A with fully degassed Purified water. Set the vacuum degasser to run continuously Prepare the calibrated stopwatch to begin timing.
- Enter 5.000 as the flow rate and run the pump.
- When the flow and pressure are stable, simultaneously insert the outlet tubing into the volumetric flask and start the stopwatch.
- Stop the stopwatch when the bottom of the meniscus reaches the 25-mL mark on the flask.
- Record the elapsed time in seconds and the observed system pressure.
Calculate the flow rate using the following equation
Calculated flow rate = (Volume of flask/Measured time in sec.)×60
- Record the calculated flow rate
- Repeat the procedure for 1.0 ml/min, and 0.50 ml/min and record the observation
- Similarly repeat the procedure for other 3 port (port B, port C and Port D) also.
- Record the calculated flow rate.
Acceptance criteria:
Measured flow rate should be as under ± 2 % of set value
Read Article
QC facility Full Qualification Guide
Injector Linearity Test in HPLC Operation and Calibration
Weigh and transfer about 50.0 mg of caffeine to a 50 ml volumetric flask. Add 30 ml mobile phase, dissolve with the help of sonication and make up the volume with the same solvent (1000 ppm). Dilute 2 ml of the resulting solution to 100 ml with mobile phase (20ppm). Make the system ready as given in procedure for operation.
- Equilibrate the column, fill the vial with test solution and put in sample tray.
- Inject duplicates injection each of 5µl, 10µl, 20µl, 50µl and 100µl of the test Solution
- HPLC Having 500µl injection loop, Inject Duplicates injection each of 5µl, 10µl, 20µl, 50µl ,100µl, 300µl and 500µl of the test solution
- Calculate the coefficient of determination for different set of injection volumes.
- Acceptance criteria: The Correlation Coefficient of determination should be greater than 0.999.
Injector Precision
- Follow instrument condition as per:
- Inject 20 mL of 20 ppm Caffeine solution six replicates.
Acceptance criteria: RSD of area counts of six replicates injections should be NMT 2.0%.
Flow Rate Consistency
RSD of retention time of six replicates injections under injector precision should be NMT 1.0%.
Auto Sampler Carryover Test
Follow instrument condition as per
Inject the 20 µl volume of blank injection followed by caffeine solution (1000 ppm) and then inject blank injection.
Observe any peak eluting at the retention time of caffeine in last blank
Calculate the carry over as per the formula:
(Area of peak in blank solution)÷( Area of peak due to caffeine in 1000 ppm caffeine solution)×100
Acceptance criteria: The auto sampler carryover NMT 0.01 %
Detector Wavelength Accuracy
Chromatographic Condition: Follow instrument condition as per except wavelength. Prepare the instrument method at each wavelength from 200 nm to 208 nm, 240 nm to 248 and 268 nm to 276 nm.
Record the observation in calibration report.
Acceptance criteria: The maximum absorbance should be at 205 ± 2 nm & 272 ± 2 nm. The Minima of peak response of caffeine should be obtained at 245± 2 nm.
Detector Linearity Test
Filtered and degassed mixture of 70 volumes of Methanol and 30 volumes of water.
To perform the detector linearity test prepare 5 ppm, 10 ppm, 20 ppm, 50 ppm and 100 ppm concentration solutions of caffeine in mobile phase.
Column Oven Temperature Calibration
Select the Column Temperature set field and enter 25°C and record the observed temperature Similarly, enter 40°C, 60°C, 70°C and 90° C and record the observed temperature Allow sufficient time for the column chamber temperature to reach and stabilize at the set temperature.
Acceptance criteria: The observed value should be ± 2.0°C of set point temperature.
Sample Cooler Calibration
Set temperature 5ºC, 10ºC, 15ºC, 25ºC, 35ºC and 40ºC of ALS Compartment.
Put the prove of digital thermometer in the compartment of sample cooler.
Set temperature and observed temperature.
Acceptance Criteria Summary
| Test | Acceptance Criteria |
|---|---|
| Flow Rate | ±2% |
| Injector Precision | RSD ≤2% |
| Flow Rate Consistency | RSD ≤1% |
| Carryover | NMT 0.01% |
| Wavelength Accuracy | As per caffeine maxima/minima |
| Detector Linearity | R² >0.999 |
| Column Heater | ±2°C |
| Sample Cooler | ±2°C |
Common Errors During HPLC Operation and Calibration
Air bubbles
Pump pressure fluctuation
Peak splitting
Baseline drift
Ghost peaks
Carryover
Wrong method selection
Change History
| Effective Date | Nature of Revision | Change Control No. | Reason For Revision |
FAQ’s For HPLC Operation and Calibration
Q:1 Why is HPLC calibration important?
Answer: HPLC calibration ensures that the instrument produces accurate, precise, and reliable analytical results. Regular calibration verifies the performance of critical parameters such as flow rate, injector volume, detector response, wavelength accuracy, and temperature control.
Q:2 How often should an HPLC system be calibrated?
Answer: Typically, HPLC systems are calibrated at predefined intervals such as every six or twelve months depends on impact assessment.
Q:3 What are the main calibration parameters of an HPLC system?
Answer: The primary calibration parameters are following
- Flow rate accuracy
- Injector linearity and precision
- Wavelength accuracy
- Detector linearity
- Column oven temperature
- Sample cooler temperature
- Autosampler carryover
Q:4 What is the acceptable flow rate accuracy for HPLC?
Answer: The measured flow rate should be within ±2% of the set flow rate.